

How do rising diesel prices affect mining company earnings?
VERIDAPT | October 2026

The short answer: Higher diesel prices raise the cost of moving material, operating equipment and, at some mines, generating power. That can reduce operating margins or increase cash costs per ounce, pound or tonne. But it does not follow that reported earnings must fall: stronger metal prices, production, price hedging and by-product credits can offset the fuel headwind. Recent miner disclosures demonstrate both effects.
For mine managers, the actionable question is not only “How much did the diesel price rise?” It is “How many litres does this site need to produce and move each unit of output, and where does a higher fuel price enter the results?” Transparency throughout the supply chain, from procurement to consumption, can help maximise diesel usage efficiency and make every litre count.
What miners reported in 2026
These selected company results use different currencies, commodities, reporting periods and measures. They are not an industry average and should not be added together.
|
Company |
Fuel-related disclosure |
Earnings interpretation |
|
Trekor Metals Limited (formerly Taseko Mines Limited; NYSE American: TGB) — Gibraltar copper mine |
Diesel costs increased C$7.1 million versus Q2 2025, primarily from higher prices. |
An observed increase in diesel spend, not a disclosed C$7.1 million EBITDA loss. Gibraltar C1 cost per pound fell because other operational and credit effects offset pressure. [1] |
|
Barrick |
Each US$10/barrel oil-price change has an estimated direct diesel cost of US$12/oz of gold and US$0.04/lb of copper. |
Price sensitivity, not a measured Q2 diesel earnings loss. Adjusted EBITDA rose 51% year on year amid higher realized metal prices. [2] |
|
Capstone Copper |
For the remainder of 2026, a US$0.10/litre diesel move changes direct costs by approximately US$5 million: US$3.5 million in C1 and US$1.5 million in capitalized stripping. |
Timing and accounting classification matter. Q2 adjusted EBITDA reached US$354 million. [3] |
|
Agnico Eagle |
Diesel is approximately 10% of operating costs (7% direct; 3% freight). A 10% price change is estimated to move H2 cash costs approximately US$4/oz direct and US$2/oz indirect. |
Fuel affects both the site and its supply chain; higher costs partially offset EBITDA growth while guidance remained unchanged. [4] |
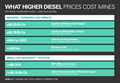
What the graphic shows
The graphic reports published per-unit values without converting them into one “earnings loss.” Capstone attributed +US$0.23/lb at Mantoverde and +US$0.19/lb at Pinto Valley to higher diesel prices in its Q2 discussion. Fortuna’s +US$24 per gold-equivalent ounce versus annual-guidance assumptions combines diesel and contractor-price inflation—not diesel alone. Ramaco management estimated diesel added approximately US$3 per ton produced against prices at the beginning of 2026; that denominator differs from tons sold. [3, 5, 6]
The second section contains projections rather than measured Q2 effects. BHP estimates that each US$10/barrel change in its diesel benchmark moves Western Australia Iron Ore unit cost by approximately US$0.15 per tonne. Trekor Metals Limited (formerly Taseko Mines Limited; NYSE American: TGB) estimated that Gibraltar H2 operating costs could be approximately US$0.15 per pound of copper higher year on year if elevated diesel prices persisted. [1, 7]
Why a higher diesel bill can be hard to see
Diesel reaches operating results directly through haulage and mobile equipment, and indirectly through freight, contractors and supplies. Fuel purchased or hedged earlier can delay the effect of spot prices. Some mining costs, such as stripping, can be capitalized rather than immediately appear in unit cash costs. Agnico separates direct fuel and freight exposure; Capstone separates C1 costs and capitalized stripping. [3, 4]
A tonne of iron ore, a pound of copper and an ounce of gold-equivalent output are different denominators. Two mines paying the same price may have different diesel intensities because of haul distance, pit depth, grade, payload and power supply. A mine-level price-and-volume bridge explains the exposure better than applying a universal industry percentage to earnings.
How mines can manage the exposure
- Reconcile fuel from deliveries through tank inventory, transfers and dispensing; investigate a discrepancy before labelling it theft or savings.
- Separate price from litres used. Record landed diesel price and consumption by asset, operating area or contractor.
- Compare burn rates only across similar duties; account for payload, route, gradients, idling, engine hours and maintenance.
- Track productive output alongside fuel, such as litres per tonne moved and cost per unit of saleable product.
- Evaluate hedging, storage, fleet and power changes against site-specific costs and productivity. Reliable fuel data supports these decisions.
In a supplier-reported South American case, VERIDAPT says asset identification and engine-hour data exposed abnormal haul-truck burn rates; the mine subsequently reduced annual fuel use by 1.7 million litres, valued by Veridapt at US$2.55 million. This is site-specific, not a general savings guarantee. Another VERIDAPT case reports reducing a delivery-to-consumption reconciliation discrepancy from above 10% to below 1%. A lower accounting discrepancy alone does not prove the same reduction in fuel consumption.
What this means for earnings
Higher diesel costs can erode site economics even when a company reports stronger earnings. Barrick and Capstone disclosed fuel exposure alongside strong results; Trekor recorded higher diesel spend even as Gibraltar C1 cost per pound fell. Assess the mine’s exposure by measuring price, litres, productive output, indirect costs and accounting timing separately. [1, 2, 3]
For a clearer site-level view, VERIDAPT’s fuel-management platform can record fuel monitoring, delivery, transfer and dispensing data. Start by asking what your existing data can reconcile—and which assets or processes need investigation.
Research note: Selected Q2 2026 and FY2026 public disclosures, reviewed 27 September 2026. Company price sensitivities are estimates; VERIDAPT case studies are supplier-reported and site-specific. Figures are in US dollars unless marked otherwise.
Wayne Arthur is Vice President, Mining at VERIDAPT. A mechanical engineer with more than 25 years experience in mining, manufacturing and project delivery, he leads a global team delivering VERIDAPT's IoT solutions for fuel, emissions and energy optimization and management.

Share this article


Read next


VERIDAPT| October 2026

VERIDAPT | September 2026