Fuel management systems best practice
initiatives and KPIs
VERIDAPT | June 2025
The following initiatives can help ensure best practice fuel and lubricant management across mine sites and rail yards. Veridapt has prepared these recommendations along with operations executives from some of the world’s most successful mining and rail operations. Initiatives to optimize industrial fuel management include:
- Appoint a fuel champion,
- Measure system uptime,
- Conduct tank inventory reconciliation,
- Conduct regular maintenance and administration,
- Enable vendor-managed inventory,
- Monitor deliveries,
- Develop a “no free fuel” culture,
- Check service truck productivity,
- Optimise the refuelling process,
- Identify irregular fuel (and lubricant) consuming assets,
- Monitor flow rates,
- Use fuel burn to determine preventative maintenance,
- Measure fuel quality, and
- Implement solutions at the gantry.
Appoint a fuel champion.
The most crucial activity for FMS best practice is to appoint a fuel champion at each site and an accountable executive across all operations. This person should have authority across all departments to maintain, monitor, analyse, and report on fuel management activity and productivity to drive performance and continuous improvement.
Recommended KPI: Provide a regular system uptime report to a senior manager.
Measure system uptime
If you operate a large mine site or rail network, your fuel management system may contain over 500 components at more than 50 locations. Therefore, your fuel champion must be confident that each component is operating optimally to ensure that the correct data is collected to drive performance and help manage FMS maintenance programs.
Your fuel champion should therefore prepare a regular system uptime report, which includes the following:
-
Metrics for online status. Are the field controllers pushing all the data to the web application?
-
Are the connected peripherals (e.g., RFID readers, tank gauges) connected and operational?
-
Are any system components bypassed? If so, for how long?
-
What percentage of transactions are automatically identified? How many have required a manual PIN? Have there been any system overrides or bypasses?
-
Can each tank be accurately reconciled with all dispenses accounted for to the fuel-consuming asset?
Recommended KPI: System uptime should be accurately measured and reported weekly, with an outcome of >98%.
Conduct tank inventory reconciliation
Tank inventory reconciliation is a key performance indicator (KPI) that should be established for any Fleet Management System (FMS), as it indicates the system's overall health. Typically, five key steps are required to enable tank reconciliation. The following is an overview of these steps.
Step 1: Monitor deliveries
This step requires either flow meters with adequate air eliminators to remove entrained air or a gauged transaction service, which can calculate deliveries based on changes in tank volume measured by the level gauges and account for any simultaneous dispenses. After considering each tank and its associated infrastructure, the most suitable approach is determined.
Having the right technology at the delivery point can enable you to collect and aggregate this data and capture input from the delivery driver, such as company name, driver ID, docket number, and docket volume. This is essential data for reconciling any discrepancies.
Step 2: Monitor inventory levels
Accurate level gauges are critical in realizing an FMS's many benefits. In addition to the gauge itself, it’s essential to ensure it is calibrated correctly, the strapping table is accurate (a strapping table converts a level/height into a volume), and the network connectivity is reliable. Some gauges can recalibrate themselves or require minimal calibration, so the maintenance of the gauge is often model-specific, and any manufacturer’s guidelines should be followed.
Step 3: Monitor dispenses and transfers
The final component of tank reconciliation is monitoring all dispensing and transfers out of the tanks. Each dispense or transfer must be to an identified equipment item or tank. This is important, as many of the benefits possible from an FMS require that dispensing transactions be traced to an equipment item rather than accounted for in bulk. This also helps to identify and rectify any discrepancies when this additional level of traceability is available.
Step 4: Implement automatic equipment and personnel identification
Implementing an auto ID of the fuel-consuming asset is one of the most critical factors in ensuring data accuracy and accountability in the reconciliation process. It is recommended that you authenticate
ID tags can identify heavy, medium, and light fuel-consuming equipment. Identifying operators via a personnel identification system can increase data quality, accuracy, and accountability. Best practice FMS operation assumes that equipment and personnel ID are enabled, and manual ID is available as a backup, but disabled.
Recommended KPI: When it comes to tank inventory reconciliation, the level of reconciliation is dependent upon the measurement transducers available, the size of the tank, and calibration. However, as a general rule, less than +/-1% should be achieved, and some sites achieve less than 0.5%. Additionally, to ensure that fuel and lubricants are accounted for the individual asset, a KPI that measures the number of key bypass or supervisor override transactions should be less than 1%. This allows some equipment items missing RFID tags to be refuelled, but still have the fuel captured and accounted for.
Step 5: Monitor performance
Regular monthly reporting is essential for tracking reconciliation performance. Your reports should indicate your key reconciliation error percentage, and an error trend report should also be run to predict any trends in your errors. The following are examples of reports from Veridapt’s proprietary system, AdaptFMS, which measures tank inventory reconciliation.
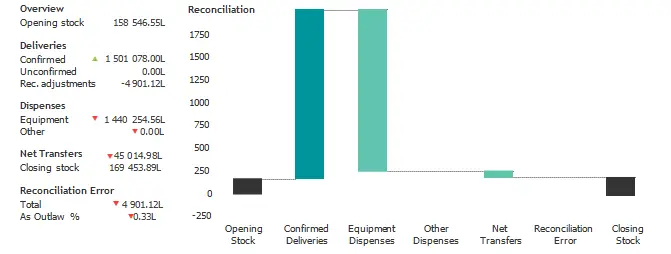
Figure 1: Reconciliation and Rebate Report
daptFMS’s Reconciliation and Rebate report (Figure 1) is an example of an error trend report. It shows the results for a virtual tank (3 x 100,000L interconnected tanks). It details opening stock levels for all confirmed deliveries, credits to the tank inventory level, and all dispenses and transfers out of the tank, which are debits. Other dispenses should be within the target band. These are an accumulation of bypass transactions or errors. In this figure, the difference between opening stock plus deliveries minus dispenses minus transfers and closing stock is the reconciliation error for the period. The report also includes any unconfirmed deliveries in the table, so a check can be made to ensure all deliveries are accounted for. This value is not included in the reconciliation error calculation. If the error is outside of the KPI level, an investigation into the cause of the error should be conducted.
Figure 2: Transaction analysis for one month showing unauthorised and erroneous transactions that required investigation
The monthly error transactions diagram (Figure 2) shows a site summary for a month. The left-hand pie chart highlights the percentage of transactions of each type, and the right-hand pie chart indicates the volume that this represents. The full report contains details that allow several important insights:
-
For the month of the report, 88.5% of the transactions and 96.6% of transaction volumes were automatically identified.
-
The corresponding values for manual transactions were 8.3% and 1.7%. The reason for the larger manual transaction-to-volume ratio is that most manual transactions were smaller oil and coolant transactions in the workshop that were performed manually, as well as light vehicle transactions for non-tagged vehicles.
-
0.2% of volume was dispensed via supervisor override, which is acceptable given the requirement to refuel equipment and vehicles that may not have working ID tags or were not in the equipment database.
In this example, the unauthorised and erroneous transactions are of concern and worthy of investigation. Unauthorised transactions indicate that product flow has occurred without a corresponding transaction being authorised. Error transactions are generated if issues are encountered while processing the transaction.
The large count of unauthorised transactions (2.4%) with a smaller corresponding volume (0.5%) indicates that many small volumes are being created outside of an open transaction. Commonly, this is due to meter rattle (the meter vibration and sending pulses the system picks up as flow, solved by using quadrature meters) or small volumes generated on pump start-up or after a transaction has closed. Once diagnosed, these can be resolved. There is also 1% of error transactions, indicating an issue with the flow measurement hardware. The next step is to determine the locations.
Figure 3: Location of error and unauthorized transactions
Figure 4: Daily transaction type breakdown
The location and error and unauthorised transactions diagram (Figure 3) allows mine operators to investigate, in detail, the individual dispense points highlighted in the site report that are responsible for the error and unauthorised transactions. In this case, a single location was responsible for most of the issues.
The daily transaction type breakdown diagram (Figure 4) provides a day-by-day breakdown so operators can isolate incidents that have caused the issues and investigate them further.
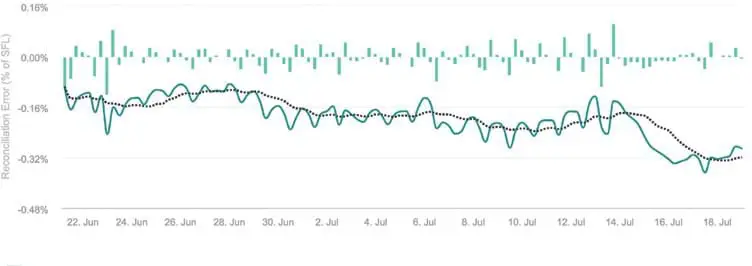
Figure 5: Daily reconciliation error trend
By isolating incidents and determining the root cause, essential cultural changes can be made, such as ensuring system issues are reported and resolved promptly. In this case, the report indicates that a flow meter was not resetting, creating erroneous transactions.
If previous investigations have not explained issues, studying a daily fuel reconciliation error trend report (Figure 5) can help. The daily reconciliation error trend graph shows the daily reconciliation error in a diesel fuel tank for a month when calculated inventory levels are compared to tank gauge readings.
As flow meter error drifts in one direction, there will typically be a gradual trend in one direction (this can be complicated when multiple outflow meters are connected to a tank). Any large spikes or an increase in the rate of change can indicate a problem that may impact accurate reconciliation.
By analysing trends, a hypothesis can be developed and investigated. The errors highlighted by Figure 5 show that the accumulated error is within the range expected from the flow meter. However, the latter increase in error should be monitored, and the meter recalibrated if necessary.
Conduct regular maintenance and administration.
Regular maintenance and administration are vital to achieve the recommended KPI of reconciling all tanks to <1%. Site hardware must be regularly maintained, system and database administration needs to be well managed, and system instrumentation should be periodically calibrated.
Recommended KPI: For diesel meters, six-monthly calibrations and 12-monthly calibrations for lubricants and coolant are recommended.
Enable vendor-managed inventory
A best practice Fuel Management System should have web-enabled reporting to provide viewing of real-time data to numerous authorised personnel from any location. This enables vendor-managed inventory, where vendors completely manage bulk fuel resupply to the site. This reduces internal site staff requirements for tank dipping and reorder requests and can also lower the price of fuel delivery by reducing inconvenience events for the fuel supplier.
-
To ensure the success of any vendor-managed inventory system, it’s essential to ensure that:
-
A selected list of hydrocarbon vendor personnel should be given viewing access to the system. Vendors should only be set up to see tanks relevant to their fuel supply contract.
-
An automatic fuel inventory email is set up to generate and send stock on hand reports, with the desired frequency.
-
System inventory alarms should be set up at min-op and max-op levels. The min-ops is the minimum diesel inventory level the site can safely carry without impacting operations. A lower min-ops level means cash is not tied up in inventory. This is determined with consideration of the following:
-
Site total consumption
-
Volatility or change in consumption
-
Length of the supply chain
-
Risks to the supply chain include weather, road closures, supplier lead times, and supplier flexibility.
The max-ops level can also impact the inventory costs. A lower max-ops reduces inventory levels and is generally a function of the min-ops level. A site must determine how narrow the band between the max-ops and min-ops levels can reasonably expect to be, and this is often negotiated with the supplier. By setting minimum and maximum levels and providing real-time inventory data to fuel and lubricant suppliers, a more disciplined and safer supply chain can be implemented with less over-ordering and, importantly, protection from running out of fuel. Many miners use this functionality to significantly reduce their diesel inventory holdings, freeing up working capital. The fuel champion should view the frequency of the tank history page once a week to monitor and assess vendor performance.
Recommended KPI:
-
Min-ops and max-ops levels should be established and monitored for optimisation of inventory.
-
Vendor KPIs should include the number of drift events out of the “management band”, e.g., a maximum of one per month.
-
Days of inventory held should be monitored.
-
Vendor-managed inventory implemented.
If you are managing your fuel inventory internally, the same principles apply. Setting and managing a tight storage band will result in fewer delivery rescheduling and diverting events, partly executed deliveries, and similar events with cost penalties.
Please also refer to the following section, Monitor deliveries, for further vendor management and verification tips.
Monitor deliveries
Delivery monitoring is one of the most fundamental steps towards ensuring good fuel management governance. Data from your FMS can also be used for mandatory environmental and tax-related submissions to the local and federal governments. Automated calculation engines should be included in your software and should be easily activated. In the diesel tax rebate calculation, it’s essential to ensure that your system administrator changes the rebate rates at six-month intervals to sync with the current government policy.
From a corporate perspective, your Fuel Management System represents an independent and auditable third-party system for event and transaction record keeping. Manual overrides and changes should be traceable and easily validated.
Your FMS should also allow for cost allocations of fuel and hydrocarbons to configurable ERP codes, such as those for site departments, business divisions, contractors, and others.
The Fuel Management System should enable a three-way match. It should be able to compare metered diesel volume to driver-entered docket volume and allow a comparison to invoiced volume.
Any discrepancies this method identifies should be investigated as a mandatory procedure and embedded in the fuel vendor’s contract. This will ensure you only pay for delivered fuel and will enable you to identify any administration and billing errors.
To enable a three-way match, your site must ensure delivery meter monitoring of the inflow and regular calibration of the tank gauges.
A delivery variance report should be run at least once monthly and/or coinciding with the goods receipt/invoice approval process. The report should compare the primary volume set in the system to the secondary volume.
An example of this process is to set the metered volume at the point of delivery as the primary and the docket volume entered by the driver as the secondary. Suppose tank level readings are available for the period in which the delivery occurred. In that case, the enterprise software should execute an algorithm to calculate the delivery according to the level gauge. This should take into account any dispensing that would be occurring at the same time.
Recommended KPIs:
-
Where meters are used, they should be calibrated at all delivery locations. Meters should have an accuracy of +/-0.55.
-
If level gauges are used to monitor deliveries utilising the gauged transaction algorithm (GTS) (which is available in FluidIntel’s AdaptIQ software), gauges with a +/-1mm accuracy in reference conditions and better than +/-4mm installed accuracy should be used, particularly in larger tanks.
-
Reduce material delivery variance by 50%. Identify and investigate all delivery variances over 4% within 72 hours of occurrence. Set alarms to notify the fuel champion immediately if an out-of-tolerance delivery occurs.
-
Where a delivery driver notes a discrepancy greater than 2% between the delivery docket and the inflow meter, they must report the incident to their supervisor for notification to the client within 24 hours of occurrence.
Develop a “no free fuel” culture.
There may be circumstances on site where fuel must be obtained, but the Fuel Management System is not allowing a dispense to occur. There can be numerous reasons for this, though the reality is that it typically occurs very rarely. The system can be bypassed to ensure sites can obtain fuel at all times despite the FMS operation. Employees can abuse this function on sites with a poor fuel management culture. Many systems can remain in bypass for significant periods unnecessarily, making it difficult or impossible to meet reconciliation targets.
To remedy this, Veridapt has developed multiple features supporting the creation of a “no free fuel” culture on a mine site or railyard. The basic functionality starts with a supervisor overriding the code for unauthorised equipment. A remote supervisor override, which uses a one-of-a-kind system-generated code for single transaction approval, can be beneficial.
A best practice Fuel Management System practice should also include a fuel dispense limit feature, allowing system administrators to limit the volume dispensed to any specific equipment item over a set period. Typically used for light vehicles and a contractor fleet, this function can set weekly dispense limits and stop a dispense once a limit is reached.
Having a key switch that can bypass your FMS is also beneficial. In bypass mode, the system controls and authorisation functions are entirely bypassed, and controls are handed over to manual operation.
It is recommended that bypass keys be kept in a central maintenance office, away from the dispensing locations, and handed out only in the case of system malfunction or emergency.
Recommended KPI: Less than 0.5% of transactions are bypassed annually.
Check service truck productivity.
VERIDAPT has tracked thousands of service truck shifts and seen a wide range of performance between sites and operators. The data indicates that the best operators are up to 120% more effective than the least effective mine site operators. Service trucks are a high-value asset with significant operating and maintenance costs. Optimising the productivity of service trucks creates a valuable productivity gain and can save a site millions of dollars per annum.
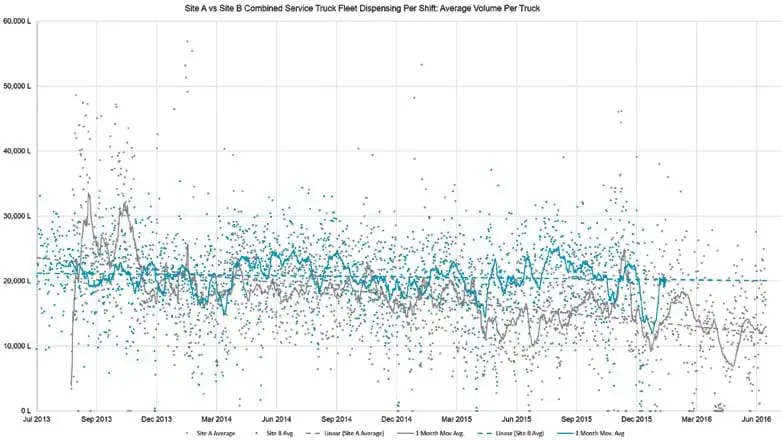
Figure 6: Service truck benchmarking between site A and B.
Figure 6, for instance, compares mine fuel service truck dispensing per shift between two similar sites run by the same company. This indicates that refueling productivity has decreased over time at one mine site while it is maintained at another site. Acting on this data can substantially improve productivity and reduce the required service trucks and operators.
Recommended KPI: The volume of fuel dispensed per shift target is the most relevant KPI to implement. Mine site operators can be benchmarked against each other and coached to improve their performance. This can reduce standard deviation and increase refueling efficiency, resulting in more mine sites or rail yards performing at or near best practice, optimizing productivity and reducing working capital invested.
Optimize the refuelling process.
Refueling fixed and mobile assets is a constant process, and large sites have tens of thousands of fuelling and lubricant transactions per year. The cost to the business of these activities can be significant. The time spent pumping fuel is only a portion of the time spent refuelling, which can also include driving to refuelling areas, operators climbing down off equipment, or service trucks attending fixed assets in remote locations. Reducing the number of refuelling events can increase the adequate availability of equipment, reduce labour, and minimise potentially hazardous activities relating to refuelling, such as exiting equipment and moving around heavy equipment.
sumption per diesel usage at a fleet/category level to easily identify equipment items that are deviating from the norm.
Recommended KPI: A site should aim for a baseline standard deviation of fuel consumption per category and reduce it by 20%.
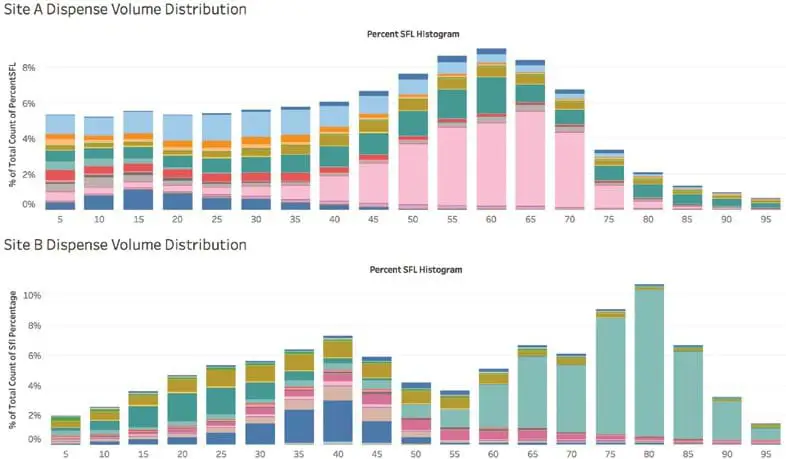
Figure 7: Refuelling comparison for site A and site B
VERIDAPT has reviewed refuelling cadence across numerous mine sites and has identified great variability between sites, as shown in Figure 7. It’s important to note that sites use different methods and processes for refuelling, meaning it can be difficult to make direct comparisons between all mine sites. However, reducing refuelling events means more equipment availability.
Figure 7 compares the refuelling practices of two sites. The x-axis of the graph indicates how much of the total equipment tank capacity was filled in the transaction, and the y-axis indicates the frequency with which it occurred. For example, the far left column indicates that approximately 6.5% of the time, site A operators refuelled less than 5% of the tank capacity. Alternatively, site B filled 5% of the tank capacity about 3% of the time.
Higher columns to the right indicate that the sites were filling up more of the tanks’ capacity per transaction. The colours in the stacked column represent different categories of equipment. Values over 100 indicate whether the equipment was overfilled or incorrectly set up in the equipment profile. The large green bar for site A was an incorrectly configured equipment class.
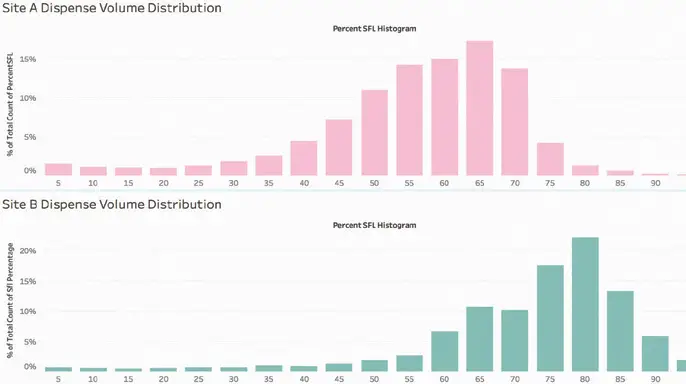
Figure 8: Comparison between sites A and B, for haul trucks
Figures 8, 9, and 10 provide further insight into the refuelling process, providing a more detailed view—in this case, haul trucks. This is an interesting group of vehicles to compare, as they are the most tightly controlled equipment in terms of utilisation.
Figure 8 compares mine sites A and B again, but only for haul trucks. It should be noted that haul trucks are filled more efficiently (meaning when they are closer to empty) than the rest of the general fleet. However, there is still a significant difference between the two sites. Care must be taken in these comparisons, as there may be valid operational reasons for the differences. This graph can also indicate areas of improvement. In this comparison, most mine haul trucks at site A refuel when they are 35% full, while at site B, they are 20% full.
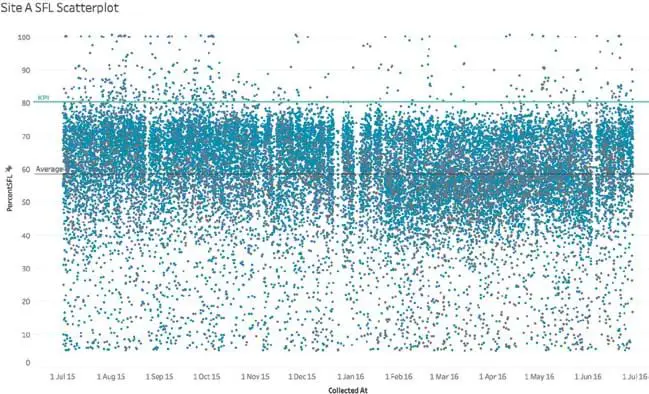
Figure 9: Refuelling as a percentage of SFL for a haul truck fleet
Figure 9 shows refuelling as a percentage of SFL for a haul truck fleet as a scatter plot, with each dot representing a refuelling transaction and each colour a model. Transaction volumes below 5% have been excluded. A data point at 100 indicates the tank was empty when refuelled. A data point of 50 suggests the tank was half full. The average remaining tank capacity was over 40%, and the green line represents a 20% capacity remaining KPI when refuelled. 24,000 transactions were analysed.
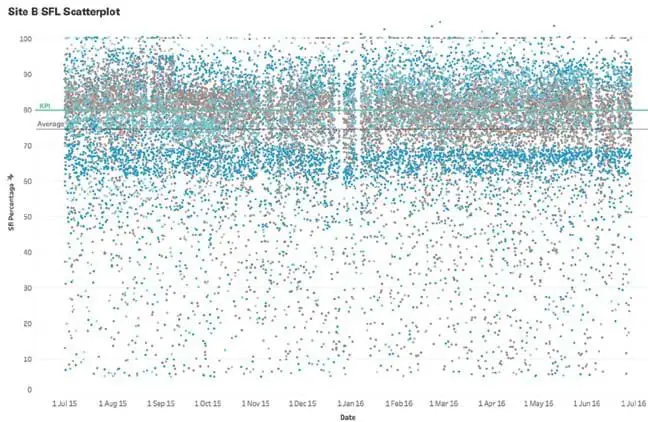
Figure 10: Refueling as a percentage of SFL for a haul truck fleet.
Figure 10 shows refuelling as a percentage of SFL for a comparative site's haul truck fleet. The green line represents a KPI of 20% capacity remaining when refuelled. 20,000 transactions were analysed. Please note the greater transaction volume and the narrower distribution.
Figures 8, 9, and 10 analyse haul trucks, the most significant fuel-consuming assets. However, improvements are available when looking at all fuel-consuming assets, as they tend to be more widely distributed. The reduction in fueling events could number in the tens of thousands. VERIDAPT provides benchmark data on key metrics for customers every month to track refuelling cadence, as well as the ability to compare various sites.
Recommended KPI: When setting refueling optimization KPIs, a rail yard or mine site should consider its operations, practices, and infrastructure. One potentially powerful KPI is optimising when haul trucks are refuelled – for example, only refuelling when the fuel tank is 20% full. At the least, sites should measure refuelling cadence and look to improve it.
Identify irregular fuel (and lubricant) consuming assets
The effectiveness and power of this analysis depend on excellent database maintenance. All fuel-consuming items should be tagged, grouped, and categorised per company-wide agreed principles.
Every month, we recommend analysing all categories, starting with heavy users and working through to light vehicles, identifying the top 10 fuel users per category, and then analysing root causes.
Identifying anomalies in coolant and lubricant use can also help prevent engine failures and major repairs with the proper fuel management system. Identifying preventive maintenance policy compliance and potential equipment downtime can significantly impact operations costs and uptime at a mine site or rail yard.
With the system in place, it is possible to view lubricant/coolant consumption per diesel usage at a fleet/category level to easily identify equipment items that are deviating from the norm.
Recommended KPI: A site should aim for a baseline standard deviation of fuel consumption per category and reduce it by 20%.
Monitor flow rates
A best practice Fuel Management System should be able to monitor and report flow rates at each dispensing point. This data is instrumental in detecting potential issues with pumping systems, filtration systems, control system tuning, and potential meter factor drift. It is a useful leading indicator for potential system issues and can be used to justify or investigate future modifications of pumping systems.
Monitoring dispense point flow rates not only identifies minor issues before they become big disruptions to refuelling operations, but also ensures that vehicles’ refuelling time is minimised to get vehicles back into production faster.
It’s recommended that each dispensing point has, at a minimum, transactional peak and average flow rate monitoring enabled for every transaction, with more granular in-depth analysis conducted on at least two transactions per month.
Data analysis can identify optimal filtration swap-out times, and alarms on potential pumping faults should be established based on trends and statistical analysis.
Recommended KPI: Alarms should be set when the flow rate drops 20% below the optimum level. All alarms should be investigated to identify the root cause.
Establish a leak and calibration early warning system
It can be beneficial to use statistical inventory analysis to provide a reconciliation adjustment service to identify potential issues such as tank leaks, meter calibration, or missed transactions. This can create a transaction at the end of each day based on the difference between monitored and calculated tank levels.
Systems should allow for setting coarse alarm limits to trigger immediate user attention to investigate potential field hardware issues, missed transactions, or meter calibration errors. The system should also monitor minor errors within the alarm limits, but over a longer configurable period, which can suggest potential issues or instrumentation errors.
Recommended KPI: Monitor tank reconciliation every week and investigate large deviations of 1% or more
Monitor overfill events
Overfill event monitoring allows you to record any potential spill events on site. In this case, your FMS is an independent record-keeping platform, assisting in any compulsory environmental submissions to federal government regulators. This feature also allows for alarming and future prevention of recurring events by analyzing frequent alarms. It’s recommended that alarm limits be set to ensure minimal activation and that all events are handled immediately upon detection. Setting the limits appropriately is critical for ensuring the minimisation of false or frequent alarms, reducing the risk of operator alarm fatigue, and potential high-risk situations being ignored.
All alarm events should be reviewed monthly to investigate potential or likely issues with tanks and alarm limits.
Recommended KPI: No overfill events recorded on site.
Use fuel burn to determine preventative maintenance.
Fuel burn can be used to establish preventative maintenance intervals. The concept is that fuel burn is a better indication of engine work and the requirement for maintenance than engine operating hours, as it accounts for idling and long hauls out of deep mining pits. This technique for scheduling maintenance can significantly reduce maintenance costs. Implementing a fuel burn-based preventative maintenance program for mining vehicle fleets will optimise maintenance scheduling and eliminate preventative maintenance tasks that are performed too soon or too late. The benefits are savings via decreased unscheduled maintenance, a more efficient maintenance schedule, environmental impact, and more.
Recommended KPI: Measure and compare current scheduled maintenance intervals against fuel burn to identify if over- or underservicing is occurring.
Measure fuel quality
A best-practice FMS should also provide you with real-time data on your fuel quality, particularly particulate levels, using inline particulate monitoring. Fuel quality can be variable in some regions, or the supply chain (including the destination tanks) can introduce impurities. A quality FMS will provide an ISO count for each delivery and/or dispense to/ensure that the fuel delivered is of the required quality.
Minimising fuel filter blockages, fuel injector problems, and related issues can lead to substantial savings. Each dispense and the corresponding ISO count for each equipment item can also be tracked, providing an audit trail of fuel quality.
Recommended KPI: Refer to the required local/international standard. All fuel delivered is of the agreed-upon ISO quality. All fuel dispensed to equipment is within OEM standards.
Implementing solutions at the gantry
Where fuel is dispensed from a terminal to satellite sites, a best practice FMS should enable you to plan and track all fuel movements. It should allow you to:
-
Schedule fuel deliveries to individual tanks on site, including tracking which fuel trailer or locomotive compartment is allocated.
-
enerate load plans which include appropriate fill levels in each compartment for axle loading during transport and any special requirements dictated by the route, for example.
-
Provide a user interface and workflow for delivery drivers to load trucks with minimal errors and maximum safety.
Set KPIs for better fuel management. Contact us for more information.
This article is an excerpt from Veridapt’s Fueling Best Practice Guide for Mines. For more information, download the complete guide here.
Share this article